Figure 5
Evaluation of ImageJ for Relative Bone Density Measurement and Clinical Application
Manuel Geiger*, Galina Blem and Arwed Ludwig
Published: 15 December, 2016 | Volume 1 - Issue 1 | Pages: 012-021
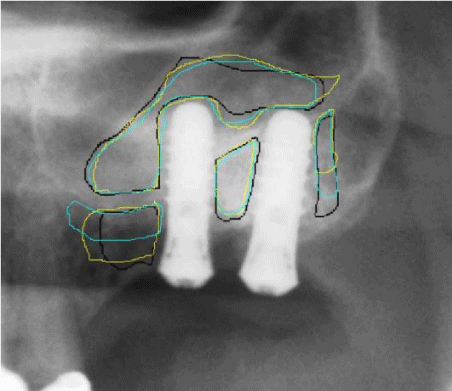
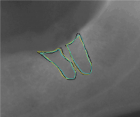
Figure 5:
Amplified detail from case 2 showing the ROIs created for the defect region and the surrounding bone by each rater (rater 1 = yellow, rater 2 = black, rater 3 = blue). Coefficient of variance over all measurements of this case: Defect = 1.306%; Surrounding bone = 5.077%.
Read Full Article HTML DOI: 10.29328/journal.johcs.1001002 Cite this Article Read Full Article PDF
More Images
Similar Articles
-
Evaluation of ImageJ for Relative Bone Density Measurement and Clinical ApplicationManuel Geiger*,Galina Blem,Arwed Ludwig. Evaluation of ImageJ for Relative Bone Density Measurement and Clinical Application . . 2016 doi: 10.29328/journal.johcs.1001002; 1: 012-021
Recently Viewed
-
Severe hypertriglycerdemia in pregnancyKrithika Muralidhara*,Shashank Dhareshwar. Severe hypertriglycerdemia in pregnancy. Clin J Obstet Gynecol. 2021: doi: 10.29328/journal.cjog.1001080; 4: 019-019
-
PTM-Fetuin-A: A Novel Biomarker for Early Detection of Diabetic Kidney DiseaseBenkova M,Petrov P,Aleksandar Petrov*,Staykova S,Zlatanova E,Chervenkov T,Nikolova S. PTM-Fetuin-A: A Novel Biomarker for Early Detection of Diabetic Kidney Disease. J Clini Nephrol. 2025: doi: 10.29328/journal.jcn.1001146; 9: 013-019
-
Intelligent Design of Ecological Furniture in Risk Areas based on Artificial SimulationTorres del Salto Rommy Adelfa*, Bryan Alfonso Colorado Pástor*. Intelligent Design of Ecological Furniture in Risk Areas based on Artificial Simulation. Arch Surg Clin Res. 2024: doi: 10.29328/journal.ascr.1001083; 8: 062-068
-
A rare case of giant ovarian serous cystadenoma presenting as psuedo-meigs syndromeRichmond Ronald Gomes*,Sayeda Noureen,Habiba Akhter. A rare case of giant ovarian serous cystadenoma presenting as psuedo-meigs syndrome. Clin J Obstet Gynecol. 2021: doi: 10.29328/journal.cjog.1001078; 4: 010-014
-
Three visionaries for HRTJoseph Loze Onwude*. Three visionaries for HRT. Clin J Obstet Gynecol. 2021: doi: 10.29328/journal.cjog.1001077; 4: 007-009
Most Viewed
-
Evaluation of Biostimulants Based on Recovered Protein Hydrolysates from Animal By-products as Plant Growth EnhancersH Pérez-Aguilar*, M Lacruz-Asaro, F Arán-Ais. Evaluation of Biostimulants Based on Recovered Protein Hydrolysates from Animal By-products as Plant Growth Enhancers. J Plant Sci Phytopathol. 2023 doi: 10.29328/journal.jpsp.1001104; 7: 042-047
-
Sinonasal Myxoma Extending into the Orbit in a 4-Year Old: A Case PresentationJulian A Purrinos*, Ramzi Younis. Sinonasal Myxoma Extending into the Orbit in a 4-Year Old: A Case Presentation. Arch Case Rep. 2024 doi: 10.29328/journal.acr.1001099; 8: 075-077
-
Feasibility study of magnetic sensing for detecting single-neuron action potentialsDenis Tonini,Kai Wu,Renata Saha,Jian-Ping Wang*. Feasibility study of magnetic sensing for detecting single-neuron action potentials. Ann Biomed Sci Eng. 2022 doi: 10.29328/journal.abse.1001018; 6: 019-029
-
Pediatric Dysgerminoma: Unveiling a Rare Ovarian TumorFaten Limaiem*, Khalil Saffar, Ahmed Halouani. Pediatric Dysgerminoma: Unveiling a Rare Ovarian Tumor. Arch Case Rep. 2024 doi: 10.29328/journal.acr.1001087; 8: 010-013
-
Physical activity can change the physiological and psychological circumstances during COVID-19 pandemic: A narrative reviewKhashayar Maroufi*. Physical activity can change the physiological and psychological circumstances during COVID-19 pandemic: A narrative review. J Sports Med Ther. 2021 doi: 10.29328/journal.jsmt.1001051; 6: 001-007

HSPI: We're glad you're here. Please click "create a new Query" if you are a new visitor to our website and need further information from us.
If you are already a member of our network and need to keep track of any developments regarding a question you have already submitted, click "take me to my Query."


