Letter to Editor
Evaluation of ImageJ for Relative Bone Density Measurement and Clinical Application

Manuel Geiger1*, Galina Blem2 and Arwed Ludwig2
1Praxis Dr. Amir Sayfadini, Hannoversche Str. 96, 30627 Hannover, Germany
2MGK Klinik Kassel, Neue Fahrt 12, 34117 Kassel, Germany
*Address for Correspondence: Manuel Geiger, Hildesheimer Str 13, 30169 Hannover, Germany, Tel: (+49) 0511 54301603 / (+49) 0176 80055561; Email: [email protected]
Dates: Submitted: 26 October 2016; Approved: 13 December 2016; Published: 15 December 2016
How to cite this article: Geiger M, Blem G, Ludwig A. Evaluation of ImageJ for Relative Bone Density Measurement and Clinical Application. J Oral Health Craniofac Sci. 2016; 1: 012-021. DOI: 10.29328/journal.johcs.1001002
Copyright License: 2016 Geiger et al. This is an open access article distributed under the Creative Commons Attribution License, which permits unrestricted use, distribution, and reproduction in any medium, provided the original work is properly cited.
Keywords: Relative bone density; Bone healing; ImageJ; Mean grey value; Repeatability; Standard operation procedure
ABSTRACT
The main method for evaluation of healing processes of the jaws in oral and maxillofacial surgery are radiological diagnostics. Quantitative description is possible by measuring the relative bone density, which puts the mean grey value of a certain area in relation to the surrounding bone tissue. In this research the intra- and interindividual variability is determined for this method and a standard operation procedure is elaborated.
Therefore ten panoramic radiographs of typical surgical indications in oral a maxillofacial surgery were analyzed by three different members of the workgroup, five times each. The measurements were analyzed with descriptive and comparative statistical methods.
The mean coefficient of variation was 2.972% ± 2.361%. The measurements of defect regions were more consistent (2.252% ± 1.928%) than the measurements of surrounding bone (3.691% ± 2.626%). The analysis of variance did not show a statistically significant influence of the different raters to the measurements (ANOVA, Pr>F = 0.9462).
Following the standard operation procedure this method seems to be an easy, cheap and close to practice way to visualize healing process of the jaws. Especially in the mandibula, but also in the maxilla with special reconsideration of the sinus-region, it seems to be suitable.
INTRODUCTION
In clinical work, classic and digital processed radiographic images are the common way to examine and evaluate pathological processes in the bony jaws. After surgical treatment, with or without augmentative procedures, radiographic follow-up is recommended by the surgical societies, as well [1]. Dealing with treatments like tooth extractions and socket preservation previous to implant placement or endodontic surgery with or without the use of bone graft substiutes, a practicable method to evaluate bony regeneration would be useful [2,3]. To determine the mineralization and structure of bone tissue quantitative computed tomography is used for vertebral failure diagnosis [4,5] but also for bone classification in the jaws [6]. Other methods like dual energy x-ray absorptiometry (DXA) mostly requires technical equipment not present in clinical practice [7]. Choosing a method for radiological examination, the ALARA principle has to be considered to minimize radiation exposure dose [8,9]. Regarding digitally processed radiographic, measurements of grey values is an easy feature of most graphic analysis software. The grey values are related to the absorption of x-rays, the radiologic density of a certain tissue. The grey values are saved in an 8-bit color space. Every pixel obtains a value between 0 and 255 in which 0 stands for black, low radiologic density and 255 for white, total x-ray absorption. Analyzing mean grey values, it has to be reconsidered, that an uncompressed file format like TIFF is being used, as compressed formats like JPG are summarizing areas of similar grey values, which leads to a loss of contrast, and significant changes in mean grey values [10]. Chiapasco et al., analyzed the evolution of mean grey values of bone defects resulting from cystectomy of large mandibular cysts. They used conventional radiographic images, digitalized with a scanner and used the grey values of a healthy tooth as a reference [11]. The “relative bone densitiy” measurements is a method to evaluate healing processes of the jaws by measuring the mean grey values of certain areas on different digital radiographic images during the postoperative progress. The relative bone density is determined by measuring the mean grey value of the bone defect and the healthy surrounding bone which is not overlapped by other anatomic structures. A quotient is formed following the formula:
A value of one means that the defect region has the same mean X-ray absorption like the surrounding bone. This is inter alia influenced by the presence or thickness of cortical bone and the density of cancellous bone. Using the surrounding bone as parameter of reference, which represents the ideal healing, this method allows to compare radiographic images of the same region which were made during the treatment and healing process. By comparing the relative bone density of control radiography with the one of the postoperative image, conclusions regarding the healing process of the bony structures can be drawn. A potential error, the use of radiographs with different parameters is diminished by forming the quotient [12]. The regions of interest (ROI) has to be selected by free hand selection and the mean grey value has to be measured by image analyzing software such as the open source software ImageJ [Wayne Rasband, NIH USA]. This free hand selection is a potential source of mistake and its effect to the results has not been evaluated scientifically by now. Furthermore the selection of the control region could influence the results of relative bone density and requires an exact interpretation of the anatomic structures displayed in the radiographic images.
To determine whether relative bone density measurements represents a valid method for clinical practice, this study wants to evaluate the repeatability of measurements of relative bone density of different anatomic indications by determine intra- and interindividual deviation. It should be examined if there are differences in the suitability in different regions of the jaws. Furthermore a standard operation procedure should be elaborated and evaluated.
MATERIALS AND METHODS
The measurement of the mean grey values was performed with the software ImageJ 1.44p (Wayne Rasband, National Institute of Health, USA). ImageJ is a free of charge software which has been used in medical and biological image analysis for a long time and has a wide range of analysis functions [13,14]. Image files can be opened and Regions of Interests (ROI) can be created automatically or by freehand selection. The ROIs can be saved and transferred to other radiographic images and edited afterwards to different projection conditions.
Standard operation Procedure
The freehand selection is a potential source of measurement error. To standardize the measuring process, a standard operation procedure (SOP) was elaborated following the recommendations of Ihan Hren and Miljavec and the anatomical structures:
• Prepare the measurement parameters in ImageJ („Analyze“–>„Set Measurements“-> check „Area“ and „Mean gray value“).
• Open the image file of the radiographic image using „Drag and Drop“ (or „
• If necessary, use the amplification function by pressing “+” or “-“.
• For every bone defect a ROI is created for the defect region and one for the surrounding bone using the “Freehand Selection” tool using the following rules:
1. For each bone defect ROIs are created for the defect and the surrounding bone on the postoperative radiograph as well as on the follow-up image, using the free-hand selection tool.
2. The ROI of the defect has to enclose the whole radiologic distinguishable part of the defect. A minimum safety distance from one pixel to any cortical structures (e.g. lamina cribriformis after tooth extractions) has to be ensured.
3. The control-region, which corresponds to the surrounding healthy bone should be localized circularly around the defect in a constant layer if possible. But the following anatomic structures has to be avoided:
• Canalis nervus mandibularis
• Cortical plates of mandibula or maxilla
• Radiological overlay of sinus maxillaris (exception: sinus floor elevation)
• Surrounding teeth or implants
• Oral cavity including the bony palate
4. The size of the control region may not exceed or go below the size of the defect by 10%
5. If the defect region is overlapped by soft tissue shadow image artefacts or other structures, the relation of overlapped, and not overlapped part of the defect has to be determined and the control-region has to be chosen in the same proportion.
6. If one of these rules could not be used properly, the image has to be locked out of the analysis.
• After creating a ROI the analysis is performed (“Analyze” -> “Measure”).
• The results can be transferred directly to statistical worksheets.
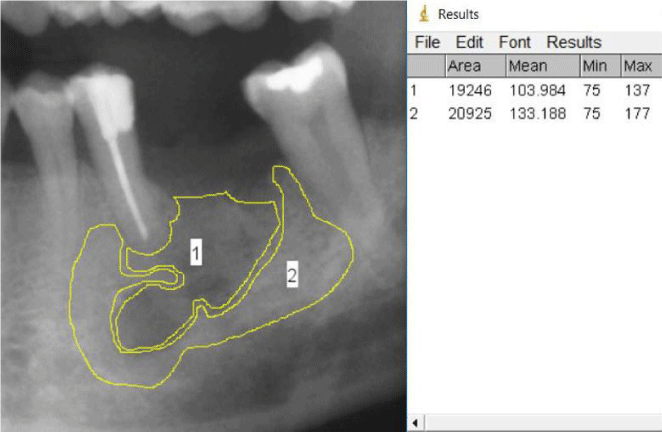
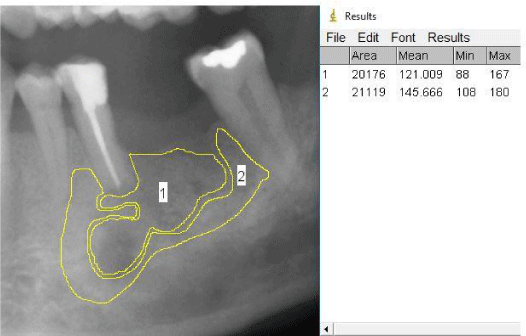
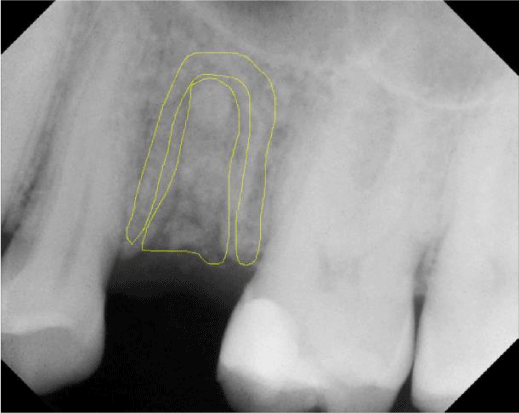
Figures 1 and 2 show examples for the selection of the regions of interest and the measurement process in the lower jaw in a postoperative and a control radiograph.
Figure 1: Amplified detail of case 4: ROI 1 representing the defect region, ROI 2 representing the surrounding cancellous bone. On the right hand the results of the measurements are shown.
Figure 2: Follow up radiograph from case 4: The ROIs were copied from the first image and adapted to the different projection on this radiograph. The results of the measurements are shown on the right.
Analysis of repeatability
Using this SOP three members of the workgroup analyzed ten panoramic radiographs five times each. The images were chosen to represent the most common surgical applications for the presented measuring procedure from the radiological database of the MGK Klinik Kassel, Germany. The procedure war approved by the ethical committee of the medical University in Göttingen (Germany) [DOK_75_2013]. No additional radiation exposure was created by the study. Table 1 shows the different indications of the used radiographs.
| Table 1: Indications of the panoramic radiographs used in this study. | |
| Case | Indication |
| 1 | condition after endodontic surgery 15 |
| 2 | condition after implantation region 026 027 and sinus floor augmentation |
| 3 | condition after extraction and socket preservation 37 |
| 4 | condition after endodontic surgery and cystectomy 35 |
| 5 | condition after osteotomy of displaced tooth 38 |
| 6 | condition after extraction and socket preservation 37 |
| 7 | follow-up radiograph 6 month postoperative image no. 1 |
| 8 | follow-up radiograph 5 month postoperative image no. 2 |
| 9 | follow-up radiograph 3 month postoperative image no. 4 |
| 10 | follow-up radiograph 6 month postoperative image no. 5 |
The analysis of the test-images was made on the same computer, independently from each other with a break of at least one day between the repetition of the measurements to preclude the risk of influence of former measurements or the other members of the workgroup. The mean grey values where summarized in a Microsoft Excel worksheet [Microsoft Excel 2013, Microsoft corp., USA] and analyzed descriptively and comparative with regard to the intra-individual variation. Concerning the inter-individual variation, an analysis of variances was performed under contribution of the staff of the Institute for medical statistics of the University of Göttingen. A “repeated measurements Anova” was performed with the statistical software SAS 9. 3 [SAS Institute Inc., Cary, NC, USA] evaluating the influence of different parameters on the outcome of the measurements [15].
RESULTS
The first impression of the workgroup was that the method was generally easy to apply on the selected cases and did not presume a lot of training or technical know-how. The software was easy to handle and the results are presented in worksheets which allow direct input to statistical analysis. Figures 1 and 2 show amplified details of case 4 and its follow up (case 9) with the Regions of Interest formed by using the SOP by rater 1 as well as some measuring examples. Table 2 shows the results of the measurements of the different members of the workgroup and the corresponding coefficient of variation.
| Table 2: Mean results, standard deviation and coefficient of variance of the mean grey value mesurements of the different members of the workgroup. | |||||
| Case | Measured region | Rater 1 | Rater 2 | Rater 3 | All raters |
| 1 | Defect | ||||
| Surrounding bone | |||||
| 2 | Defect | ||||
| Surrounding bone | |||||
| 3 | Defect | ||||
| Surrounding bone | |||||
| 4 | Defect | ||||
| Surrounding bone | |||||
| 5 | DefectSSS | ||||
| Surrounding bone | |||||
| 6 | Defect | ||||
| Surrounding bone | |||||
| 7 | Defect | ||||
| Surrounding bone | |||||
| 8 | Defect | ||||
| Surrounding bone | |||||
| 9 | Defect | ||||
| Surrounding bone | |||||
| 10 | Defect | ||||
| Surrounding bone | |||||
| MV | Defect | 1.000% ± 0.886% | 1.033% ± 0.874% | 1.321% ± 0.475% | 2.252% ± 1.928% |
| Surr. Bone | 1.509% ± 0.863% | 1.875% ± 1.150% | 2.053% ± 1.320% | 3.691% ± 2.626% | |
| Total | 1.255% ± 0.890% | 1.454% ± 1.084% | 1.687% ± 1.036% | 2.972% ± 2.361% | |
| Lines 1–10: mean results of mean grey value measurements: Line MV: mean value of coefficient of variance for each rater and for all raters |
|||||
Overall the measurements show consistent results with mean coefficients of variation for intra-individual deviation about 1.465% ± 1.005% ranging between 0.194% and 4.402%. In most cases the coefficients of variation were higher in the measurements of the surrounding bone (mean 1.812% ± 1.111% highest 4.042%) than in the measurements of the defect regions (mean 1.118% ± 0.756%, highest 3.396%). The inter-individual deviation showed mean coefficients of 2.972 % ± 2.361% ranging between 0.564% and 9.783%. In this case the measurements of surrounding bone showed higher values (3.691% ± 2.626%) than the measurements of the defect regions as well (2.252% ± 1.928%). The highest mean coefficients of variability was seen in image 1 either in the measurements of the defect- (7.123%) as well as the control-region (9.783%). The least coefficient was achieved in image 7 (0.564%). The mean coefficient of variability was significantly (p<0.05) higher for the measurements of the upper jaw (4.149% over all measurements of all raters in cases 1,2,7,8) then in the lower jaw (2.190% over all measurements of all raters in cases 3,4,5,6,9,10).
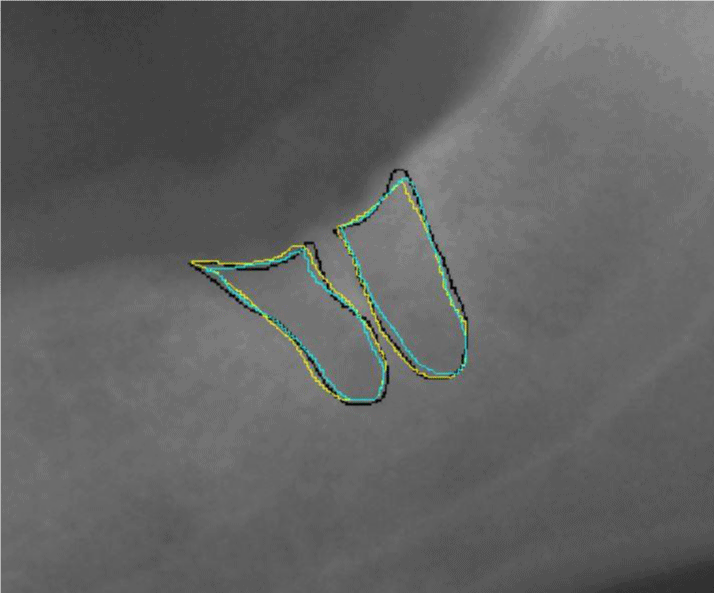
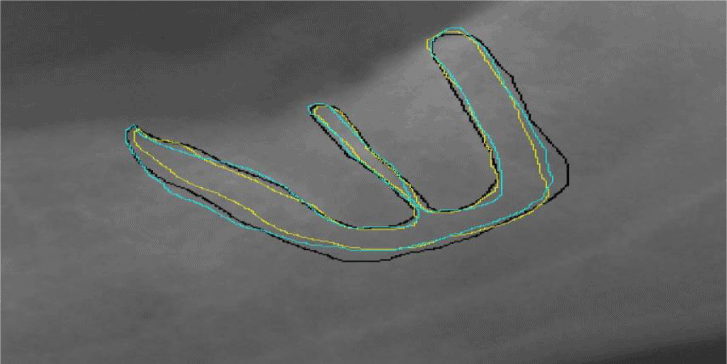
No significant influence of the different raters to the results could be noticed in the analysis of variance (Pr > F-Value = 0.9462). The combination of rater and region is not creating significant deviations either (Pr > F-Value = 0.9648). Meanwhile the mean grey values of the defects are significantly different from the values of the surrounding bone (Pr > F = 0.0323) as shown in Table 3. Figures 3-5 show selected ROIs of two different cases by all raters in comparison.
| Table 3: Results of the repeated measurements ANOVA for the different statistical parameters. | ||
| F Value | Pr > F | |
| rater | 0.06 | 0.9462 |
| measured region | 4.83 | 0.0323 |
| rater * region | 0.04 | 0.9648 |
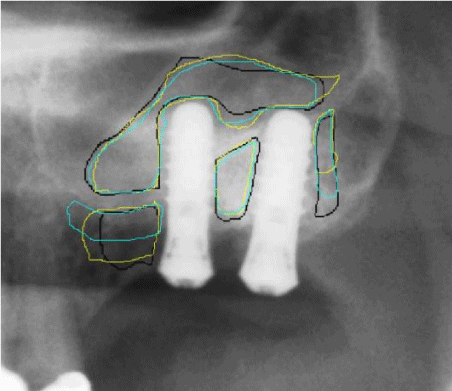
Figure 3: Amplified detail from case 3 showing the ROIs created for the defect region by each rater (rater 1 = yellow, rater 2 = black, rater 3 = blue). Coefficient of variance over all measurements of this case = 0.823%.
Figure 4: Amplified detail from case 3 showing the ROIs created for the surrounding bone by each rater (rater 1 = yellow, rater 2 = black, rater 3 = blue). Coefficient of variance over all measurements of this case = 3.418%.
CLINICAL EXAMPLES
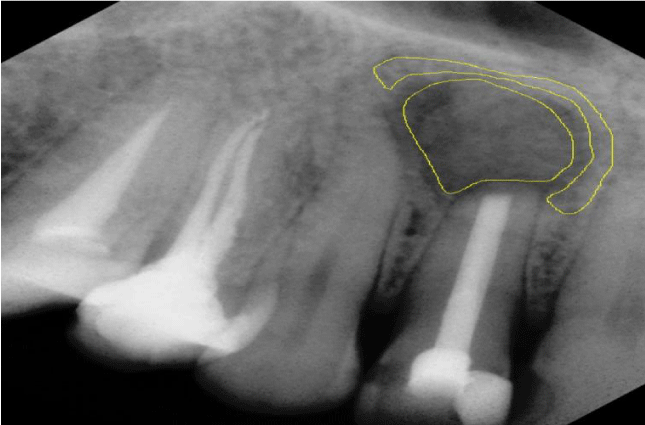
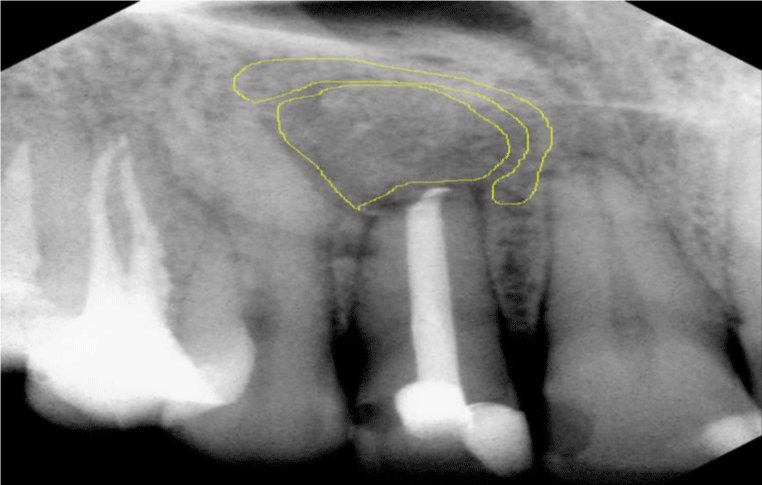
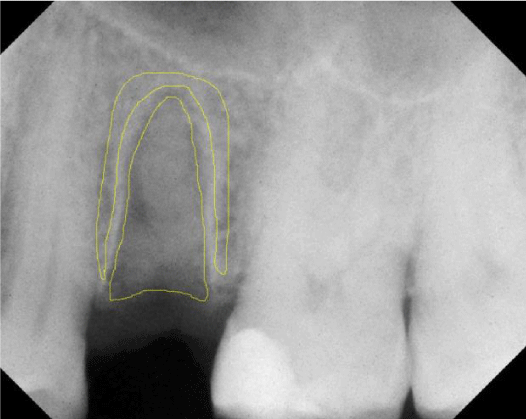
The following Figures are clinical examples for practical use of relative bone density measurements which were performed by the clinical practitioner to evaluate healing process. The ROIs were picked and analyzed five times each and the mean values were used to calculate the relative bone density. Figure 6 shows a postoperative dental X-ray after endodontic surgery of tooth 12 and defect filling with a nanocrystalline Hydroxyapatite with the selected ROIs for defect and surrounding bone. The relative bone density was 0.714. Figure 7 shows the same patient five month postoperative. The relative bone density has changed to 0.976 during this period. Figure 8 and 9 show postoperative, and four month control dental X-ray after tooth extraction and socket preservation using a nanocrystalline Hydroxyapatite as well with the respective ROIs. The relative bone density changed from 0.809 to 0.933 in the observation period.
Figure 6: Dental X-ray after endodontic surgery and defect filling. Relative bone density was 0.714 (mean grey values defect: 83.28, surrounding bone: 116.65)
Figure 7: Dental X-Ray of the same tooth five month postoperative. Relative bone density has reached 0.976 (mean grey values defect: 130.47, surrounding bone: 133.71).
Figure 8: Dental X-ray after tooth extraction and socket preservation. Relative bone density was 0.809 (mean grey values defect: 117.65, surrounding bone: 145.48).
DISCUSSION
Measurements of relative bone density is a method which has not been mentioned often in current literature and has yet not been researched regarding its repeatability and the intra- and inter-individual variability. In this study, a standard operation procedure, which leads to reproducible results, was elaborated.
The higher coefficients of variability of measurements of the surrounding bone are caused by the fact, that the selection of the ROI of the defect is a simple optical process which is oriented at the defect ZDFSVVVXVs, meanwhile the selection of the surrounding bone ROI is an interpretation of the anatomic structures using the rules of the standard operation procedure. Thereby slight differences in the selections of the ROI are possible which can lead to inconsistency of the measurements, depending on the localization an indication the method is used on. Our results indicate, that the method is more consistent in the lower jaw, which might be related to the fact that the mandibular offers more cancellous bone which could be used as reference an there are less overlapping structures which need to be reconsidered. If the rules of the standard operation procedure are used in the proper way, these inconsistencies are in acceptable dimensions.
The highest coefficient of variation resulted from the analysis of Figure 1. This case demonstrates some of the difficulties which have to be considered selecting the ROIs. There were different interpretations in the workgroup how to select the ROIs because of the direct contact to the sinus maxillaris and the lack of cancellous bone in this area. As a consequence to the high coefficient of variability in this case, the standard operation procedure should be adapted. Areas which are overlapped by the radiological projection of the sinus maxillaris have to be cut off the ROIs, except for cases which represent sinus floor augmentation.
If measurements of mean grey values are used to survey the outcome of bone healing after surgical treatment, a parameter of reference is important to allow comparison of measurements on different radiographs. Ihan Hren and Miljavec used the surrounding bone as reference in their relative bone density measurements. Compared with other references used by other authors like teeth and metal markers, the advantages of this procedure is that there are no costs and it allows retrospective analysis of bone healing using radiographs which might have not been especially taken for scientific research. Teeth could lose its reference ability by decay or dental treatment. Furthermore a relative bone density value of one could be defined as the ideal healing parameter, a situation in which the mineral density of the defect cannot be distinguished from the surrounding healthy bone [11].
The relative bone density is a quick, easy, cheap parameter and also a close to practice tool which could have various possible uses in oral and maxillofacial surgery as well as in the evaluation of endodontic or periodontic treatment. It could also be used as a surrogate parameter for healing of bone defects in clinical studies if there are no histological samples. Nevertheless, the user has to keep in mind that there could be other causes for a change in mean grey values such as sclerosing fibrosis, mineralized tumors, or the introduction of radiopaque foreign material into the bone defect such as bone substitutes or own bone transplantation. There could only be considered relative changes in bone density compared with surrounding bone. Measurements of the absolute mineral density could not be realized with this method.
The clinical examples show the potential of this method. It allows to give a more precise statement of the bone regeneration which occur in the jaws in a certain healing period. With further research it might be used in clinical practice as it comes to the decision whether surgical procedures like endodontic surgery or socket preservation techniques has come to success. Therefore we suggest studies which compare the proposed method with qCT or histological specimens to further verify the measurement results.
For image analysis the free of charge software ImgaeJ could be recommended which has been proven in several medical analysis, but also an integration of this method into dental x-ray imaging software would be conceivable. Amplifying the images on the screen helps to freehand select the ROIs. Also a diagnostic monitor in an ideal setting benefits the analysis. There are clinical studies in preparation to use the benefits of this method to analyze the healing of bone grafts in oral and maxillofacial surgery.
REFERENCES
- Sitzmann F. Wann sind zur Sicherung von Diagnose und Therapie Röntgenaufnahmen nötig? Stellungnahme der DGZMK 2/93 V 1.0, Stand 12/92. Published by: DGZMK 1993.
- Horowitz R, Holtzclaw D, Rosen PS. A review on alveolar ridge preservation following tooth extraction. J Evid Based Dent Pract. 2012; 12: 149-160. Ref.: https://goo.gl/gBOShV
- Pecora G, De Leonardis D, Ibrahim N, Bovi M, Cornelini R. The use of calcium sulphate in the surgical treatment of a 'through and through' periradicular lesion. Int Endod J. 2001; 34: 189-197. Ref.: https://goo.gl/VUED49
- Gowin W, Saparin PI, Kurths J, Felsenberg D. Measures of complexity for cancellous bone. Technol Health Care. 1998; 6: 373-390. Ref.: https://goo.gl/7Hwfze
- Thomsen FS, Peña JA, Lu Y, Huber G, Morlock M,et al. A new algorithm for estimating the rod volume fraction and the trabecular thickness from in vivo computed tomography. Med Phys. 2016; 6598. Ref.: https://goo.gl/uKwk2y
- Norton, MR, Gamble C. Bone classification: an objective scale of bone density using the computerized tomography scan. Clin Oral Implants Res. 2001; 79-84. Ref.: https://goo.gl/AhCKbU
- Devlin H, Horner K, Ledgerton D. A Comparison of Maxillary and Mandibular Bone Mineral Densities. J Prosthet Dent. 1998; 323–327. Ref.: https://goo.gl/y8e6op
- Winkler SR, Booss J. Comparison of techniques for recovering murine cytomegalovirus from a macrophage-enriched subpopulation of mice. J Clin Microbiol. 1980; 12: 785-789. Ref.: https://goo.gl/zfx4vv
- Huda, W. Radiation risks: what is to be done? AJR AM J Roentgenol. 2014; 124-127. Ref.: https://goo.gl/j2GC2w
- Yasar F, Apaydin B, Yilmaz HH. The effects of image compression on quantitative measurements of digital panoramic radiographs. Med Oral Patol Oral Cir Bucal. 2012; 1074-1081. Ref.: https://goo.gl/dXC4iK
- Chiapasco M, Rossi A, Motta JJ, Crescentini M. Spontaneous bone regeneration after enucleation of large mandibular cysts: a radiographic computed analysis of 27 consecutive cases. J Oral Maxillofac Surg. 2000; 942-948. Ref.: https://goo.gl/GaTvxu
- Ihan Hren N. Miljavec M. Spontaneous bone healing of the large bone defects in the mandible. Int J Oral Maxillofac Surg. 2008; 1111-1116. Ref.: https://goo.gl/boQANP
- Schneider CA, Rasband WS, Eliceiri KW. NIH Image to ImageJ: 25 years of image analysis. Nat Meth. 2012; 671-675. Ref.: https://goo.gl/A0lzi3
- Abramoff, M.D, Magalhães, Paulo J, Ram, et al. Image Processing with ImageJ. Biophotonics International. 2004; 36-42. Ref.: https://goo.gl/xPSsx4
- Chesher D. Evaluating Assay Precision. Clin Biochem Rev. 2008; 23-26. Ref.: https://goo.gl/k08cXd
